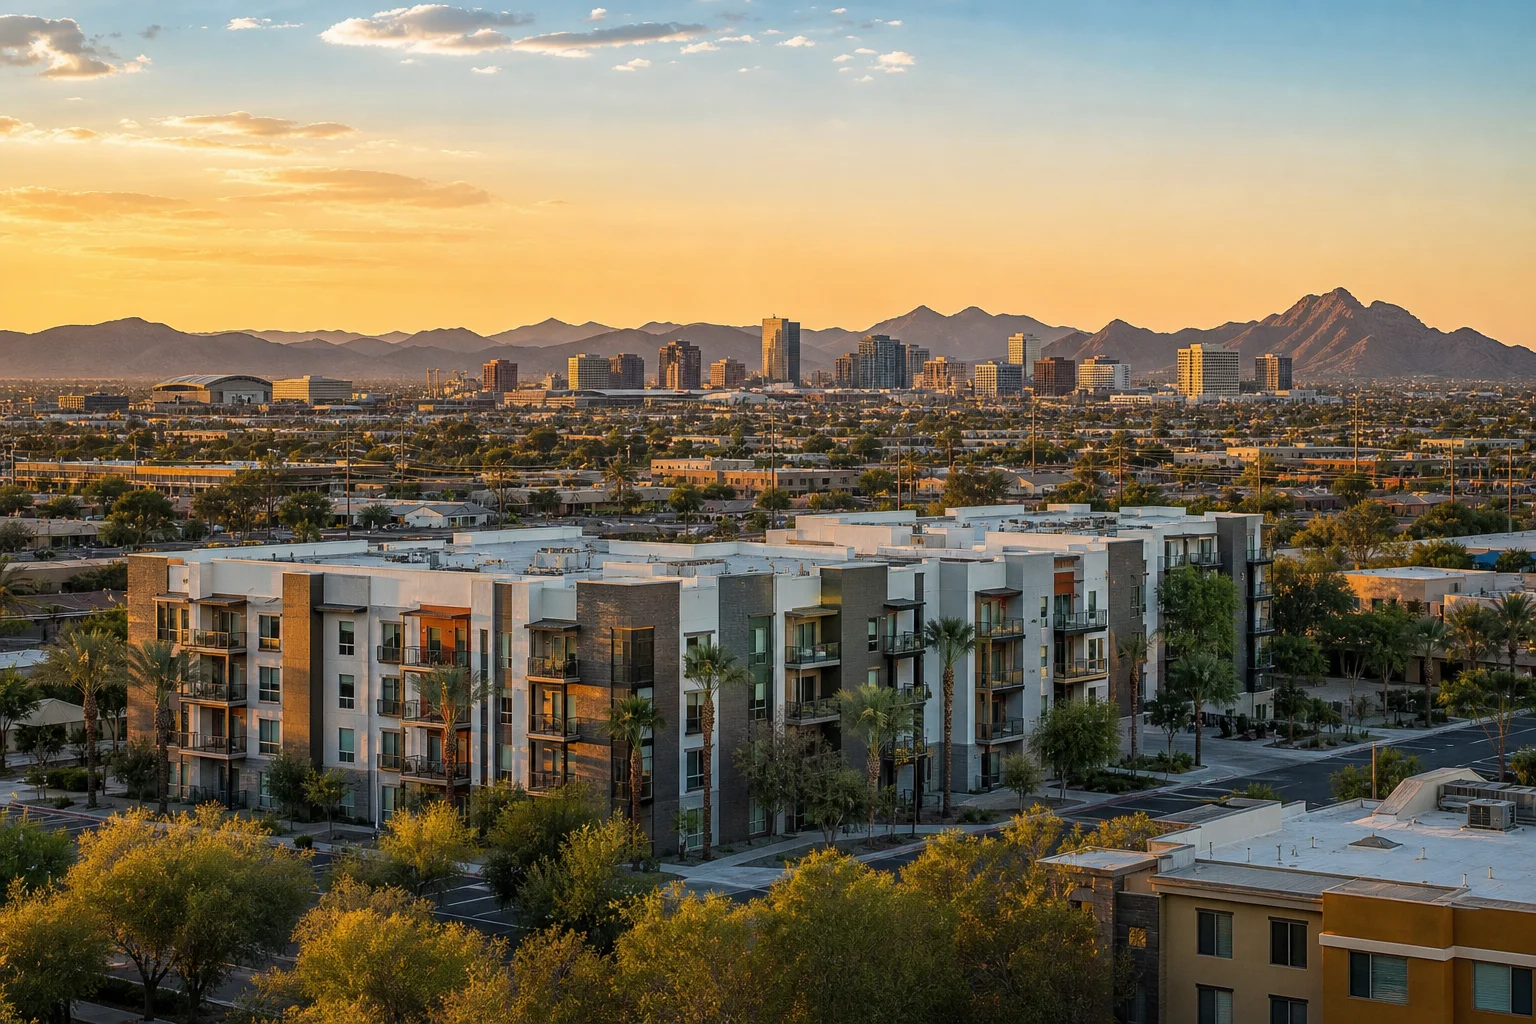
Multifamily investment sales in Phoenix metro have attracted consistent institutional and private capital throughout the post-pandemic cycle, driven by Arizona's documented population gains, a diversifying employment base, and a for-sale housing market that prices a large share of residents into renting. This overview maps the submarket dynamics, cap rate environment, and deal considerations shaping Phoenix apartment transactions in 2026.
By David Pierce, MHG Commercial
Why Phoenix Metro Multifamily Draws Sustained Capital
Phoenix's population growth has ranked among the fastest of any major U.S. metro over the past decade. The U.S. Census Bureau has consistently ranked the Phoenix metropolitan statistical area among the top five largest gaining metros by net population, with the region adding residents at a pace that has outpaced most comparable Sun Belt cities year over year. That baseline demand is the single most durable driver of multifamily fundamentals in the region.
The employment picture has evolved materially. Where Phoenix once depended heavily on construction, tourism, and real estate activity, the 2020s have brought major semiconductor fabrication, advanced logistics, healthcare expansion, and corporate campus investment. TSMC's fabrication facility in North Phoenix and continued Amazon, Intel, and logistics expansions in the East Valley have added tens of thousands of jobs that support stable, long-term household formation.
Those renter households need housing. Combined with homeownership costs that remain elevated relative to local incomes, the multifamily asset class in the Phoenix market has a structural demand argument that extends well beyond cyclical sentiment. That is the foundation serious investors underwrite before they look at a single deal.
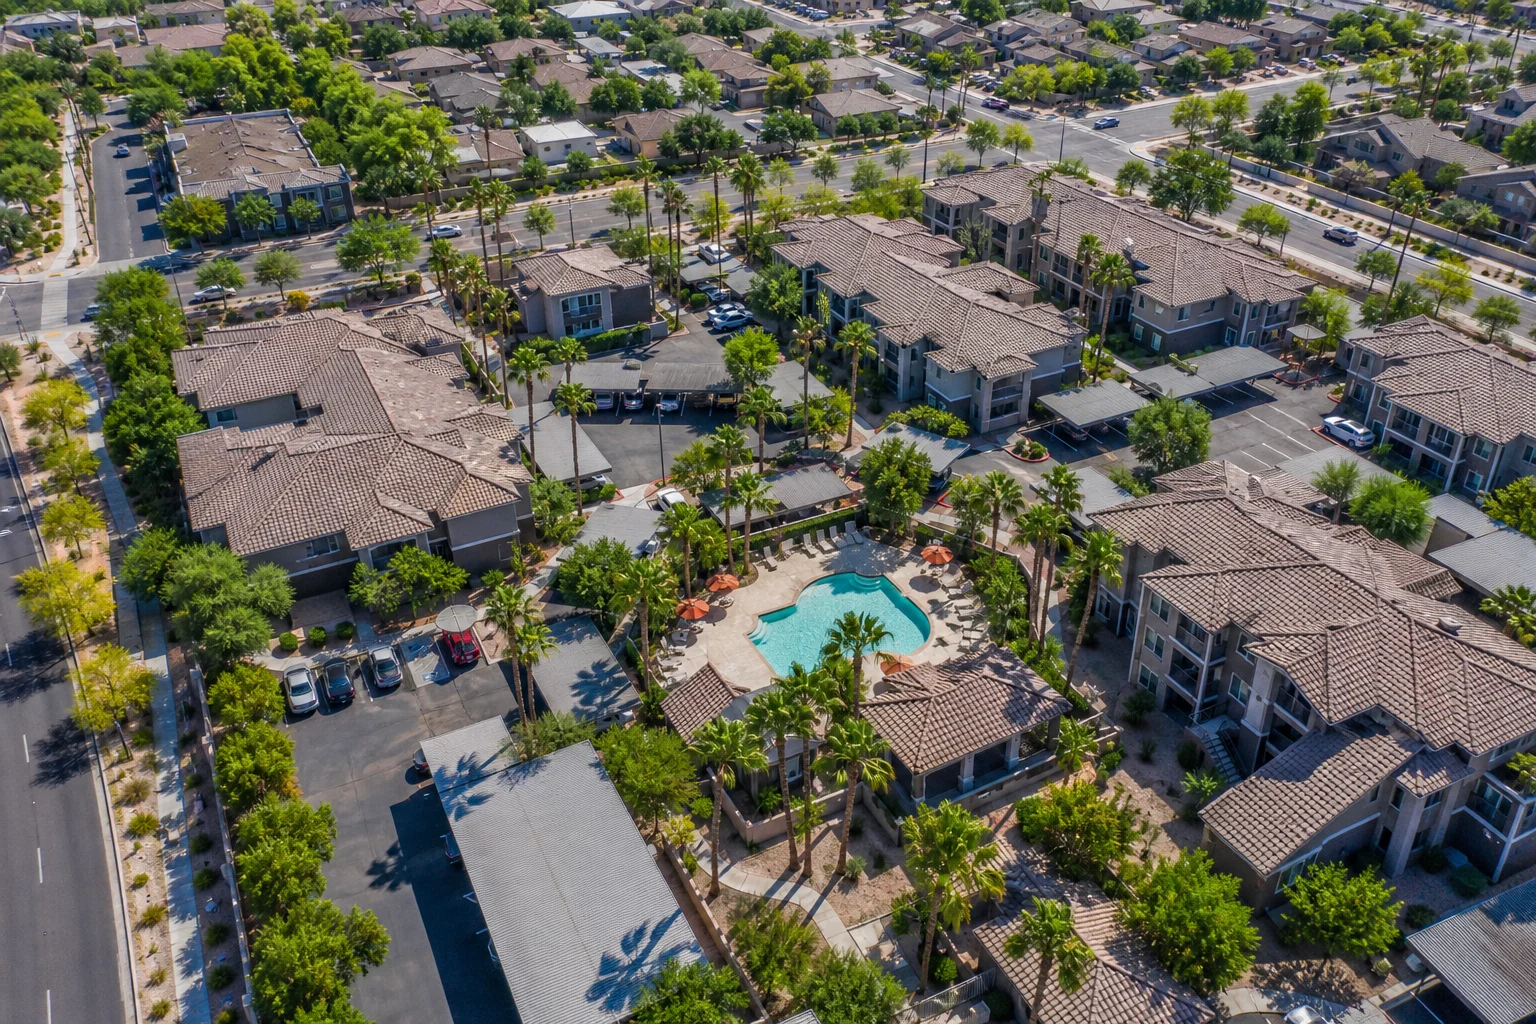
Submarket Profiles: Tempe, Chandler, Gilbert, and Scottsdale
Multifamily investment sales in Phoenix metro are not uniform across geography. Each submarket carries a distinct pricing profile, cap rate range, and buyer type. Understanding those differences before selecting a target asset is the difference between a thesis and a guess.
Tempe
Tempe is the most amenity-dense submarket in the metro. Arizona State University's enrollment base of more than 70,000 students creates a structural renter pool largely insulated from broader economic cycles. Class A communities along Tempe Town Lake and the light rail corridor command premium rents and attract institutional capital. Older Class B and Class C properties in central Tempe remain active among value-add investors who target workforce housing, a segment with strong demand and limited new supply competing at those rent levels.
Chandler and Gilbert
The Southeast Valley represents one of the most consistent performers in the Phoenix real estate market. New multifamily supply in Chandler and Gilbert has been more measured than in the urban core. Employment anchors including Intel, Microchip Technology, and a dense concentration of financial services firms have kept vacancy rates below the metro average. Buyers in this submarket favor stable assets with predictable income, and a significant share of transactions involve 1031 exchange capital seeking replacement properties with a lower-volatility profile.
Scottsdale
North Scottsdale commands the highest per-unit pricing of any Phoenix metro submarket for Class A multifamily. Institutional and high-net-worth private buyers underwrite Scottsdale assets for long-term appreciation and asset quality rather than immediate cash yield. Deal volume is thinner than in the mid-tier submarkets, but pricing discipline has held through the rate cycle. South Scottsdale, adjacent to Tempe, offers a different opportunity: older product with value-add potential and access to both ASU-adjacent renters and professionals commuting into the Camelback employment corridor.
Cap Rate Environment and Price Discovery in 2025 and 2026
The Federal Reserve's rate hiking cycle that began in March 2022 directly affected multifamily pricing across every Arizona submarket. CBRE's 2024 U.S. Multifamily MarketView documented Phoenix metro Class B cap rates in the 5.0 to 5.5 percent range by mid-2024, widened from the 4.0 to 4.25 percent range observed at the 2021 peak. Class A assets compressed further at the peak and have seen comparable unwinding.
That repricing has produced a more functional price discovery environment. Buyers who were priced out during the 2021 compression are finding assets available at a basis that supports realistic debt service coverage. Sellers who acquired during peak years are making hold-versus-sell decisions with a clear read on revised valuations rather than wishful extrapolation.
Commercial real estate transactions in Phoenix are still closing. The deals moving through are those where seller pricing expectations have adjusted to reflect the current cost of capital, where assets carry strong in-place occupancy, and where the rent growth story is grounded in real submarket data rather than projections built for a different market cycle.
What Serious Buyers Are Underwriting Today
The buyers most active in multifamily investment sales in Phoenix metro right now are stress-testing assumptions rather than extrapolating from trailing income. Three areas receive the most scrutiny.
Rent growth projections. The large supply wave delivered across the metro in 2023 and 2024 softened rent growth in several submarkets. Conservative buyers are modeling flat to modest rent growth in years one and two before returning to trend. Underwriting peak-year rent gains into a model built at today's prices introduces risk that experienced investors are not accepting in this environment.
Operating expense re-underwriting. Insurance premiums on Arizona multifamily properties have increased materially over the past three years. Property tax assessments for assets that transferred near peak pricing are resetting upward. Buyers who accept in-place expenses at face value without independently re-underwriting insurance, tax, and management costs are building acquisition models on a shaky foundation.
Debt structure. With the 10-year Treasury volatile, bridge debt with rate cap protection remains common for value-add plays. Buyers pursuing a stabilized multifamily property with in-place cash flow are locking fixed-rate agency debt where debt service coverage ratios support the purchase price at current market conditions. The capital structure conversation is as consequential as the real estate itself.
How 1031 Exchange Buyers Shape Phoenix Multifamily Deals
A significant share of multifamily investment sales in Phoenix metro involves 1031 exchange capital. Investors who have realized gains on commercial or residential properties elsewhere in Arizona or in other states consistently identify the Phoenix area as a replacement property market. The metro's transaction volume, submarket variety, and long-term demand fundamentals make it one of the most active 1031 destinations in the Sun Belt, with buyers across a wide deal size range from single assets to portfolio trades approaching several million dollars.
The 45-day identification window and 180-day closing requirement create a specific deal dynamic. An exchange buyer under deadline pressure may move faster and with greater conviction than a purely discretionary investor. Sellers who work with experienced commercial real estate advisors can structure timing and marketing to position their asset in front of this buyer pool at the right moment in the cycle.
Matching the right asset to the right buyer matters for outcome. A 1031 exchange buyer seeking passive, stable income in Chandler approaches a 24-unit multifamily property very differently than an institutional capital group underwriting a 300-unit Tempe delivery. Understanding that buyer universe before going to market is part of what distinguishes a well-run sale process from one that simply generates noise.
Frequently Asked Questions
What cap rates should buyers expect on Phoenix metro multifamily assets today?
Based on CBRE's 2024 Phoenix Multifamily MarketView, Class A assets have traded in a 4.75 to 5.25 percent cap rate range, while Class B properties have ranged from approximately 5.0 to 5.75 percent depending on submarket, condition, and occupancy. These ranges shift with interest rate movements and vary meaningfully by submarket, so current broker pricing guidance informed by live deal comps is essential before underwriting any acquisition.
Which Phoenix submarket has the strongest multifamily fundamentals for investors?
The answer depends on the investment thesis. Chandler and Gilbert offer stability and consistent occupancy with lower supply volatility. Tempe offers a structural renter base with rent growth potential tied to ASU and tech sector expansion. Scottsdale offers premium pricing with long-term appreciation upside. Each submarket suits a different capital source and hold strategy, which is why local knowledge matters more than metro-level generalizations when selecting a target.
How does the 2023 and 2024 supply wave affect current multifamily underwriting in Arizona?
The delivery wave added significant Class A inventory across the metro, softening effective rents in several corridors. Conservative buyers are modeling flat near-term rent growth for Class A assets in overbuilt areas, while Class B and Class C properties in supply-constrained submarkets are showing stronger relative fundamentals. Tracking the active construction pipeline by submarket is a core part of any credible multifamily underwriting process in Arizona today.
Is it a good time to sell Phoenix multifamily in 2026?
Sellers with in-place occupancy, below-market rents offering upside, or assets in supply-constrained East Valley submarkets are finding active buyers. Sellers in submarkets where new deliveries have pressured rents face a longer marketing process or adjusted pricing expectations. Timing a multifamily sale requires an honest read on asset positioning relative to current buyer underwriting standards, not a broad call on the investment market.
Talk to a Commercial Real Estate Advisor Who Knows This Market
The Phoenix metro multifamily market rewards preparation and penalizes assumptions. Whether you are evaluating a purchase, timing a sale, or structuring a 1031 exchange into a replacement property, a broker with direct submarket knowledge and an active buyer network makes a measurable difference in outcomes. David Pierce and the MHG Commercial team represent buyers and sellers across the Phoenix real estate market, with focus on retail, industrial, and multifamily assets throughout the metro.